Turbidity
What is Turbidity?
Turbidity, or cloudiness, in water is caused by a variety of suspended materials. The material can be both organic (plankton, sewage) and inorganic (silt, clay). The suspended material will scatter and absorb light passing through the water. The light scattered back to the observer can be affected so that the water will have a color dependent upon the type and amount of suspended matter. The cloudiness and color can be observed also if a sample of water in a transparent container is held between the observer's eye and a light source. It is this fact that is used in the turbidity meter.
What is a Turbidity Meter?
The turbidity meter measures the clarity of a water sample. A beam of light is shown through the water sample. The turbidity, or its converse clarity, is read on a numerical scale.
The turbidity meter contains a source of light, a photocell, and a meter. The path of the light is 90 degrees to the direction in which the photocell points. When a sample is placed in the light beam, light scattered by the suspended material in the sample is detected by the photocell. The photocell converts the scattered light into an electrical current that is sent through the meter. The position of the needle on the meter or a digital read-out gives an indication of the turbidity of the water sample.
Turbidity determined by the technique described above is referred to as the nephelometric method from the root meaning "cloudiness". This word is used to form the name of the unit of turbidity, the NTU. This acronym stands for Nephelometric Turbidity Unit.
The meter reading cannot be used to compare the turbidity of different water samples unless the instrument is calibrated. The aquatic science instructors calibrate the meter regularly. Calibration consists of adjusting the meter reading to a known value when a standard sample is placed in the light beam. A standard suspension is often made from a polymer called Formazin which has greater reproducibility.
What is the significance of turbidity?
Turbidity relates to the effect that suspended particles have on water clarity. High turbidity readings (low clarity) can indicate erosion and sedimentation problems. Rainfall and runoff can increase the suspended solid load in a river and make the river appear cloudy or muddy. High biological productivity related to increases in nutrients and temperature can result in increases of diatoms and other algae that contribute to turbidity. Turbidity meters can be used to estimate plankton density.
River plumes that are rich in organic matter and suspended solids are clearly differentiated from the Lake Michigan water as they enter they lake. Turbidity readings in Lake Michigan are likely to range from 0.1 to 2.5 NTU. The Grand River often ranges from 2 to 9 NTU. Spring Lake and Muskegon Lake have typical readings ranging between 0.1 and 4 NTU.
Elevated turbidity can cause an increase in temperature since suspended particles absorb heat. Reduction of light penetrating the water column due to turbidity can decrease the rate of photosynthesis. This, in turn, can decrease the amount of dissolved oxygen in the water. As suspended particles settle, they can impair the habitat needed for fish spawning and aquatic macroinvertebrates. They can also clog the gills of fish and the breathing apparatus of invertebrates. Particles serve as places of attachment for harmful microorganisms and toxic materials. Turbidity in drinking water is decreased through the process of flocculation, which involves addition of alum or a mixture of iron, lime, and chloride to cause solids to settle out.
Instructions for use of a Turbidity Tube
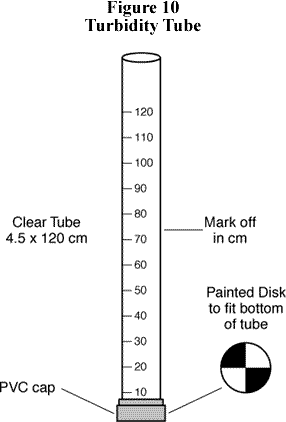
Another way to study water clarity is to use a turbidity tube ( Figure 10). Water is poured from a bucket into the turbidity tube until the image at the bottom of the tube is no longer visible when looking directly through the water column. The observer rotates the turbidity tube while looking down at the image to see if the black and white areas of the decal are distinguishable. This depth of water is recorded to the nearest 1 cm. Data is entered for each observer, not the average of the different observations. If the image on the bottom of the tube can been seen even after filling it, the depth is recorded as greater than (>) the depth of the tube.
To make a turbidity tube:
- Put a PVC cap over one end of 3-4-foot clear tube such as a fluorescent light protector. The cap should fit tightly so water cannot leak out.
- Cut a disk from wood, plastic, or cardboard the same size as the tube diameter.
- Divide the disk into fourths. Paint alternating quadrants black and white. Seal the disk by laminating or painting with varnish to make it waterproof.
- Glue the disk in the bottom of the tube, painted side facing up (toward the open end of the tube).
- Use a marker and meter stick to make a scale on the side of the tube, beginning with 0 cm at the top of the disk.
Source: Global Learning and Observations to Benefit the Environment (GLOBE)

