Student Demographics
Based on Fall 2023 enrollments
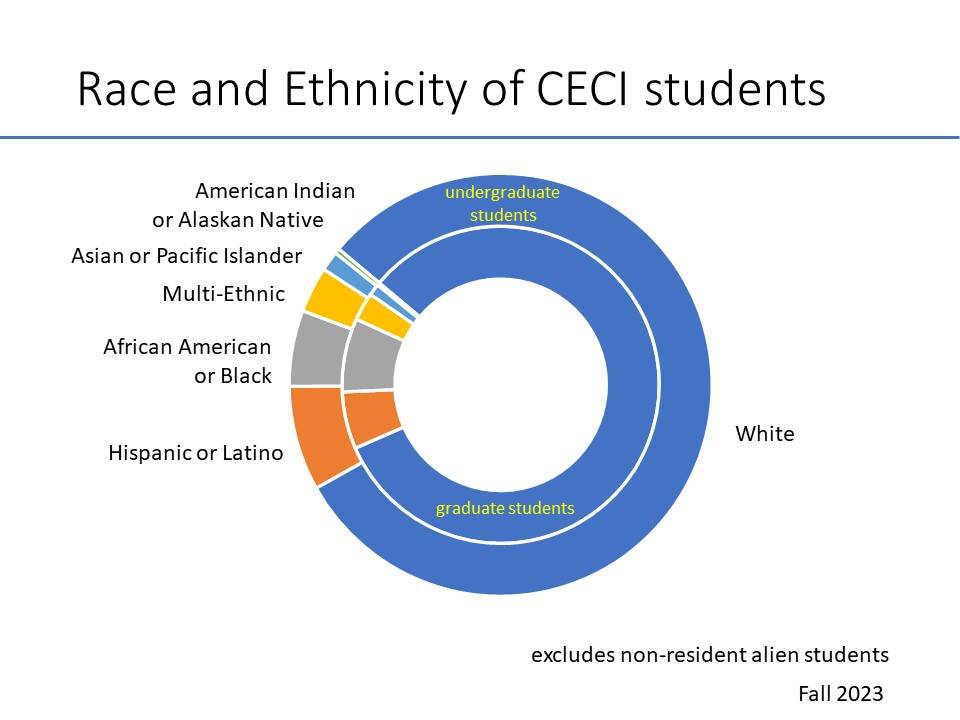
Race/Ethnicity
|
Race / Ethnicity |
Undergraduate Students |
Graduate Students |
|---|---|---|
|
American Indian or Alaskan Native |
11 |
03 |
|
Asian or Pacific Islander |
44 |
28 |
|
African American or Black |
166 |
106 |
|
Hispanic or Latino |
233 |
70 |
|
White |
2301 |
976 |
|
Multi-Ethnic |
100 |
34 |
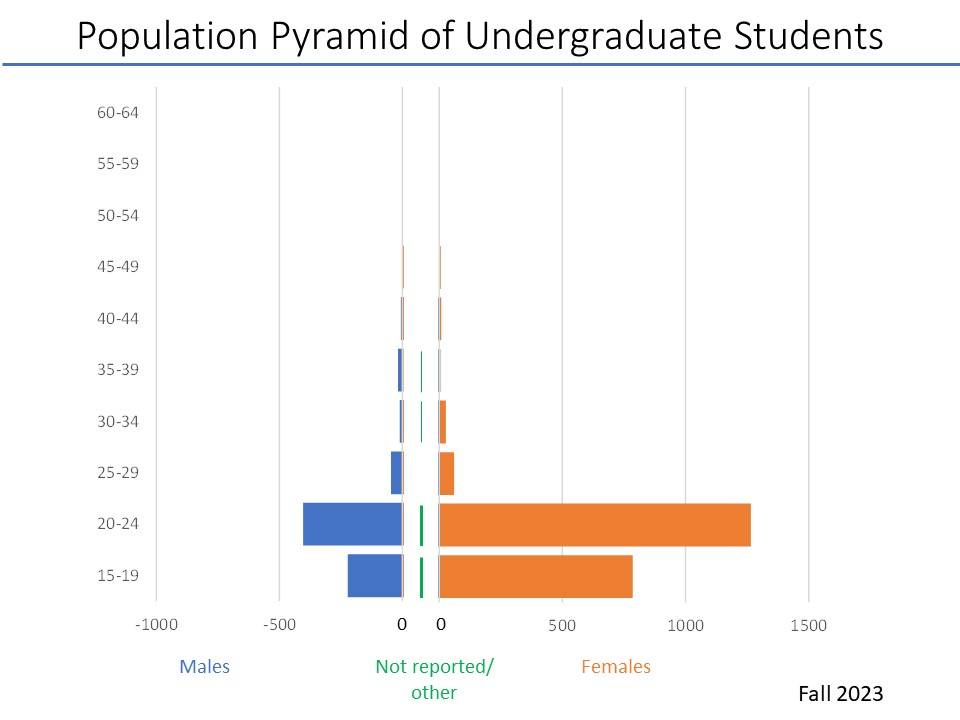
Age and Sex
|
Age of Undergraduate Students |
Female |
Male |
|---|---|---|
|
17-18 |
440 |
101 |
|
19 |
346 |
121 |
|
20 |
435 |
119 |
|
21 |
400 |
117 |
|
22 |
278 |
82 |
|
23 |
114 |
56 |
|
24 |
38 |
29 |
|
25 |
24 |
17 |
|
26-30 |
44 |
33 |
|
31-35 |
21 |
10 |
|
36-40 |
07 |
14 |
|
41+ |
13 |
06 |
|
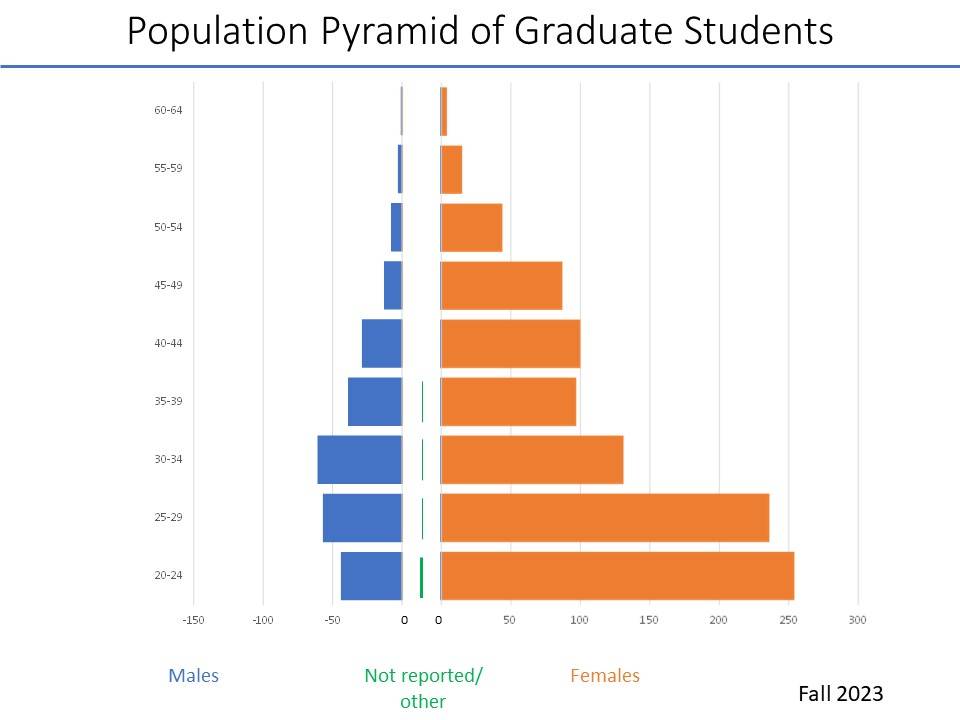
Age of Graduate Students |
Female |
Male |
|---|---|---|
|
20-24 |
254 |
44 |
|
25-29 |
236 |
57 |
|
30-34 |
131 |
61 |
|
35-39 |
97 |
39 |
|
40-44 |
100 |
29 |
|
45-49 |
87 |
13 |
|
50-54 |
44 |
08 |
|
55-59 |
15 |
03 |
|
60-64 |
04 |
01 |
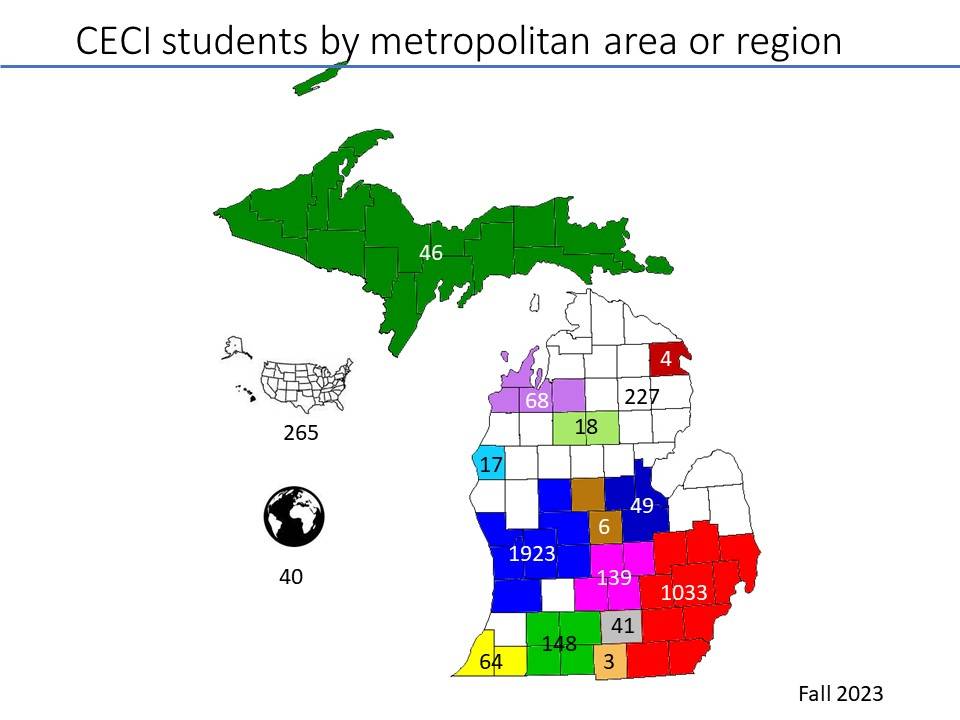
Geography (location of home address)
|
Michigan metropolitan areas and other regions |
Undergraduate Students |
Graduate Students |
|---|---|---|
|
Grand Rapids-Kentwood-Muskegon CSA |
1226 |
697 |
|
Detroit-Warren-Ann Arbor CSA |
834 |
199 |
|
Lansing-East Lansing MSA |
106 |
33 |
|
Kalamazoo-Battle Creek-Portage CSA |
90 |
58 |
|
Traverse City μSA |
44 |
24 |
|
South Bend-Elkhart-Mishawaka CSA |
52 |
12 |
|
Saginaw-Midland-Bay City CSA |
36 |
13 |
|
Jackson MSA |
35 |
06 |
|
Mount Pleasant-Alma CSA |
08 |
96 |
|
Cadillac μSA |
12 |
06 |
|
Ludington μSA |
13 |
04 |
|
Remainder of lower peninsula |
152 |
75 |
|
Upper peninsula |
28 |
18 |
|
Other states |
222 |
43 |
|
Other countries |
07 |
33 |