COVID-19 & Big Data Repository
This is a curated page of links to websites and articles that would be of interest to faculty, staff, and students at GVSU and elsewhere. Please send suggestions for additions to Ed Aboufadel.
Data Visualizations
- Michigan COVID-19 Mapping, ongoing, University of Michigan School of Public Health.
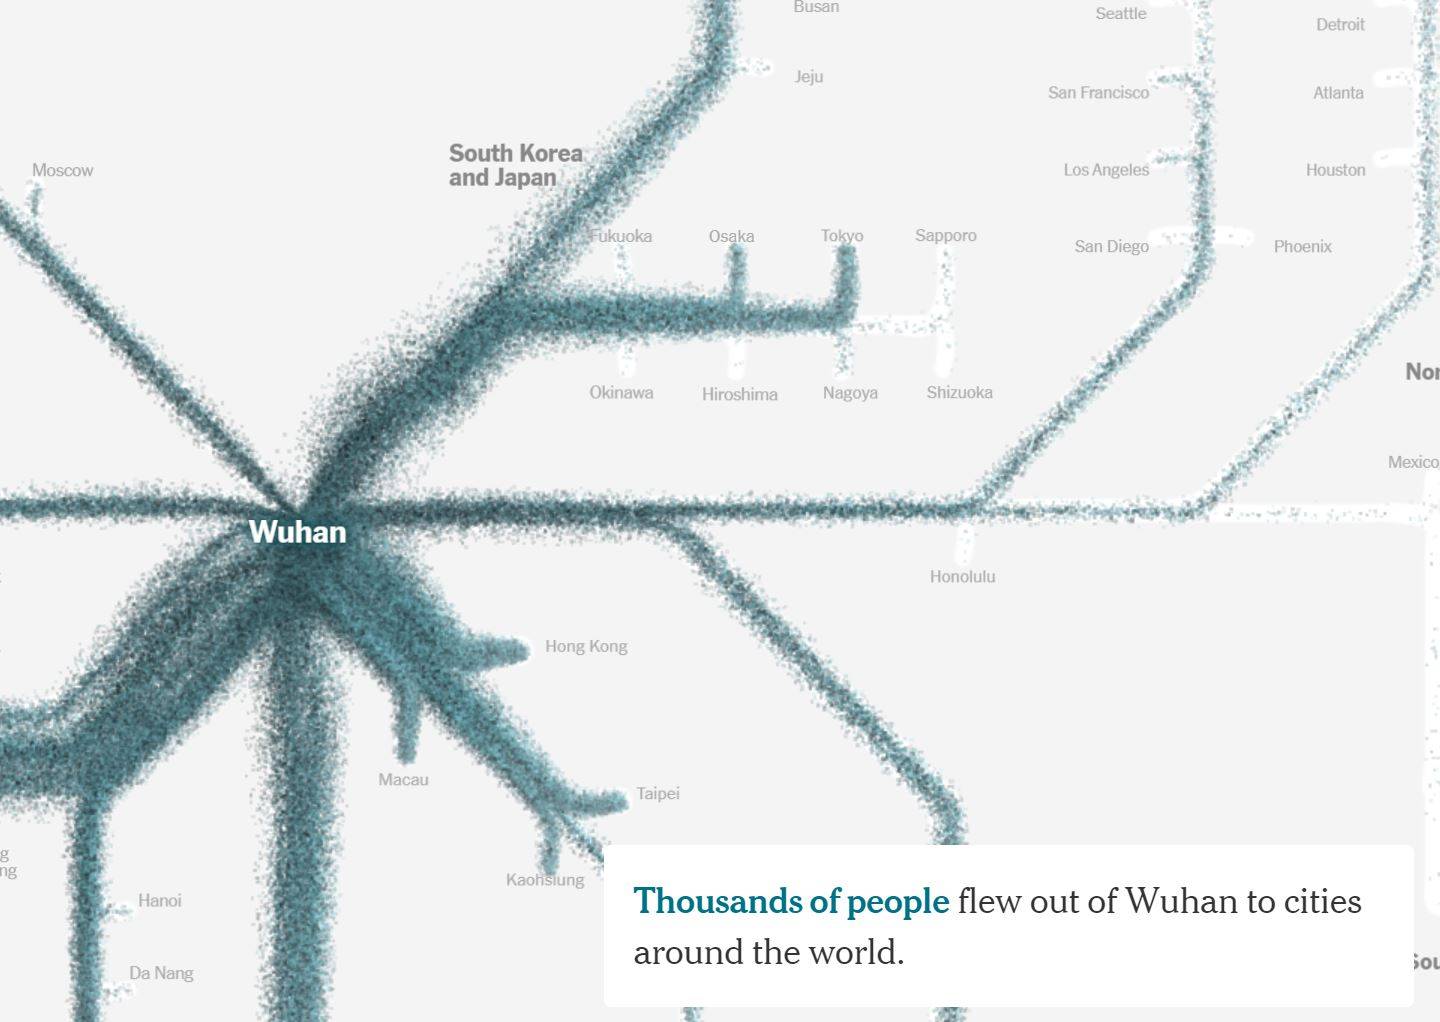
- How the Virus Got Out, 22 March 2020, New York Times. (Source of image to the right.)
- How the Virus Won, 25 June 2020, New York Times.
- Can an Algorithm Predict the Pandemic’s Next Moves?, 2 July 2020, New York Times.
- Tracking the Real Coronavirus Death Toll, 22 July 2020, New York Times.
- Airborne coronavirus videos, 11 December 2020, Washington Post.
- Animated map of COVID in the US, November 2020.
- How Severe is the Pandemic Where You Live? (USA), ongoing, Harvard Global Health Institute.
- Where Americans Are Still Staying Home The Most, 6 May 2020, Washington Post.
- Five Ways to Follow the Coronavirus, 23 April 2020, New York Times.
- Coronavirus tracked, ongoing, Financial Times.
- Why outbreaks like coronavirus spread exponentially, and how to "flatten the curve”, 14 March 2020, Washington Post.
- Worldwide visualization of global cases, ongoing, Johns Hopkins University CSSE.
- Coronavirus in Michigan, ongoing, Bridge.
- COVID-19 and Other Deaths in Michigan, ongoing, GVSU Professor Laura Kapitula.
- COVID-19 deaths in US and by State, ongoing, GVSU Professor Laura Kapitula.
- Lots and lots of charts, ongoing, GHoeberX on Twitter.
- Projections of Hospital Resource Use, ongoing, IHME.
- Social Distancing Scoreboard, ongoing, Unacast.
- Coronavirus confirmed cases and deaths, ongoing, Google.
- Data Pack of Infographics, 19 March 2020, Information Is Beautiful.
- Day-by-day animation of cases, ongoing, University of Maryland.
- Visualizations using Tableau, ongoing, Tableau.
- US Health Weather Map, ongoing, Kinsa Insights. Also, see KI's animations on their Twitter feed.
- Genomic epidemiology of novel coronavirus, Nextstrain.
- Reductions in Air Pollution in Europe during March 2020, European Space Agency.
- Tracking spring break beach-goers using cell phone data, Tectonix.
- Where America Didn’t Stay Home Even as the Virus Spread, 2 April 2020, New York Times.
- Community Mobility Reports, includes updated reports on individual Michigan counties, ongoing, Google.
- See How the Coronavirus Death Toll Grew Across the U.S., 6 April 2020, New York Times.
- How a surge of coronavirus patients could stretch hospital resources in your area, 9 April 2020, Washington Post.
- Spring travel and mobility visualizations, March 2020, GeoDS Lab @ The University of Wisconsin - Madison.
- COVID-19 Clinical Trial Tracker, ongoing, partially funded by The Bill and Melinda Gates Foundation.
- COVID-19 in the United States, GVSU Professor Peter Wampler.
Articles
- The Lessons of the Pandemic, 30 May 1919, Science.
- COVID-19 Superspreader Events in 28 Countries: Critical Patterns and Lessons, 23 April 2020, Quillette.
- The Computer Algorithm That Was Among the First to Detect the Coronavirus Outbreak, 27 April 2020, CBS News.
- How Social Distancing Flattens the Curve, 19 March 2020, Cosmos.
- The World After Coronavirus, 20 March 2020, Financial Times.
- Coronavirus Exposes How Bad America’s Homework Gap Really Is, 20 March 2020, Citylab.
- As Coronavirus Surveillance Escalates, Personal Privacy Plummets, 23 March 2020, New York Times.
- Big Tech Could Emerge From Coronavirus Crisis Stronger Than Ever, 23 March 2020, New York Times.
- Trump Wants to ‘Reopen America.’ Here’s What Happens if We Do, 25 March 2020, New York Times.
- Surveillance Self-Defense Guide for Students, March 2020, Electronic Frontier Foundation.
- Coronavirus Lockdowns Have Changed the Way Earth Moves, 31 March 2020, Nature.
- Big Data Is Helping Us Fight The Coronavirus — But At What Cost To Our Privacy?, 9 April 2020, FiveThirtyEight.
Data and Challenges
- open access dataset on GitHub
- Foot traffic to businesses and consumer points of interest -- charts and a data request form, from SafeGraph.
- The COVID-19 Open Research Dataset Challenge (CORD-19). “The CORD-19 dataset consists over 29,000 articles, among which 13,000 have full text. All of these articles are related to the study of coronavirus, such as case reports, transmission routines, environmental factors, and treatment strategy explorations.” The challenge is to use apply machine learning techniques to these articles to answer 10 scientific questions identified by the World Health Organization. For details: https://innovation.mit.edu/cord19/.
Other Collections and Teaching Resources

