Active Learning Projects for Teachers
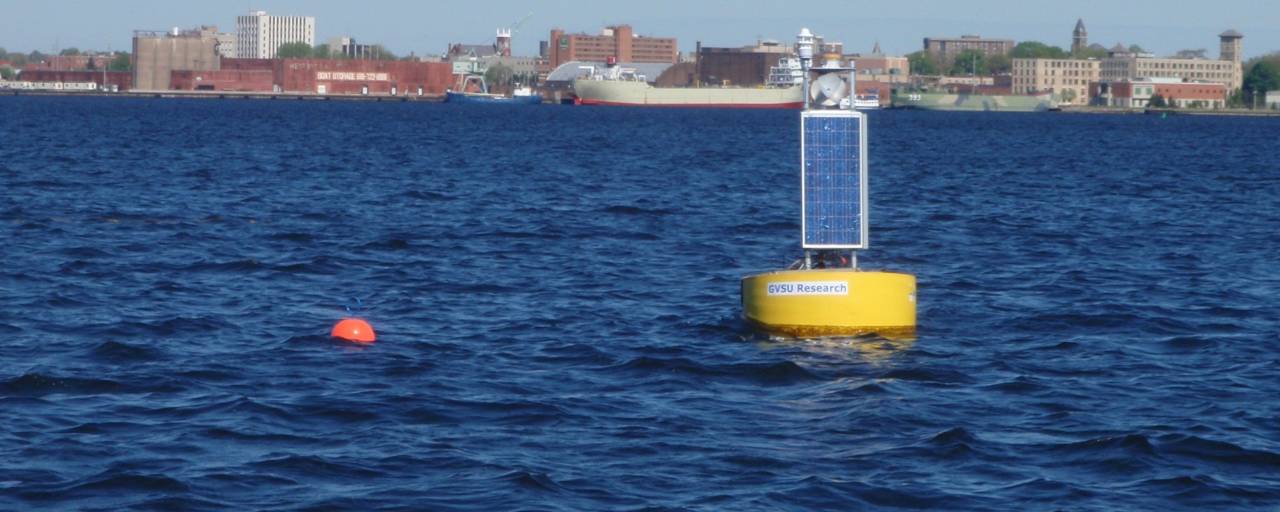
The Muskegon Lake Observatory provides a unique source of real world data that is being applied to solving real world problems, and teachers can easily access this information through this website for enhanced learning activities in the STEM fields. Data is available online going back to Spring 2011, so learning projects can be designed to not only look at what is going on now, but also to compare multi-year variation in the lake. Subject areas that are ideally suited to using the observatory data include studying:
- Seasonal changes
- Climate change
- Photosynthesis and Respiration
- Significance of storm events
- Water column dynamics
- Harmful Algal Blooms (HABs)
- Hypolimnetic Hypoxia
- Hydrodynamics
Within the Next Generation Science Standards (NGSS), applicable core areas and standards for using the observatory data in Middle and High School include:
- Matter and Energy in Organisms and Ecosystems (MS.LS-MEOE, HS.LS-MEOE)
- Interdependent Relationships in Ecosystems (HS.LS-IRE)
- Weather and Climate Systems (MS.ESS-WC)
- Earth's Systems (HS.ESS-ES)
- Human Sustainability (HS.ESS-HS)
- Chemical Reactions (MS.PS-CR, HS.PS-CR)
- Energy (MS.PS-E, HS.PS-E)
- Forces and Motion (MS.PS-FM)
- Waves (HS.PS-W)
- Electromagnetic Radiation (HS.PS-ER)
- Engineering Design (MS-ETS-ED, HS-ETS-ED)
- Links Among Engineering, Technology, Science, and Society (MS-ETS-ETSS, HS-ETS-ETSS)
Teachers can choose to use this website's graphing tool to generate graphs used to answer questions, or to just download the data for use in other ways. An important feature of the graphing tool is that it allows for generating line graphs and scatter plots. Line graphs are useful for looking at how different parameters change over time, with time on the X-axis. Scatter plots are useful for looking at the relationships between any two parameters.
So if you want to show that climate can affect what is going on in lakes, you could use the observatory data to generate simple scatter plots to show relationships between:
Air temperature and water temperature. Click link here to generate this graph: https://www.gvsu.edu/wri/buoy/data-generate.htm?concentration=1&date=5/22/13-11/20/13&graph=scatter&time=0:00,12:00&x=atmp1&y=tp001
Wind speed and dissolved oxygen. Click link here to generate this graph: http :// www.gvsu.edu/wri/buoy/data-generate.htm?concentration=1&date=5/22/13-11/20/13&graph=scatter&time=0:00,12:00&x=wspd1&y=odo004
Using line graphs, you can investigate how dissolved oxygen changes over time in the surface and bottom of lake during summer. Click here to generate this graph: http ://www.gvsu.edu/wri/buoy/data-generate.htm?concentration=1&date=5/22/13-11/20/13&time=0:00,12:00&x=date&y=odo001,odo004
...or investigate day-night oxygen changes in the lake to study photosynthesis and respiration. Click here to generate this graph: https://www.gvsu.edu/wri/buoy/data-generate.htm?concentration=1&date=9/10/12-9/11/12&time=0:00,0:15,0:30,0:45,1:00,1:15,1:30,1:45,2:00,2:15,2:30,2:45,3:00,3:15,3:30,3:45,4:00,4:15,4:30,4:45,5:00,5:15,5:30,5:45,6:00,6:15,6:30,6:45,7:00,7:15,7:30,7:45,8:00,8:15,8:30,8:45,9:00,9:15,9:30,9:45,10:00,10:15,10:30,10:45,11:00,11:15,11:30,11:45,12:00,12:15,12:30,12:45,13:00,13:15,13:30,13:45,14:00,14:15,14:30,14:45,15:00,15:15,15:30,15:45,16:00,16:15,16:30,16:45,17:00,17:15,17:30,17:45,18:00,18:15,18:30,18:45,19:00,19:15,19:30,19:45,20:00,20:15,20:30,20:45,21:00,21:15,21:30,21:45,22:00,22:15,22:30,22:45,23:00,23:15,23:30,23:45&x=date&y=odo001
For more information on how to use the observatory project to design a learning exercise, email Bopi Biddanda (biddandb@gvsu.edu) or Scott Kendall (kendalsc@gvsu.edu). Also, we would love to hear how you are using the observatory data in your classroom, so please send an email with your idea.

"Symphony" data -- MLO data plotted as if it were notes on a musician's score

